Food Hall Economics 2026
How Developers Get Paid, Where the Money Comes From, and the Questions to Ask Before You Sign an Operator
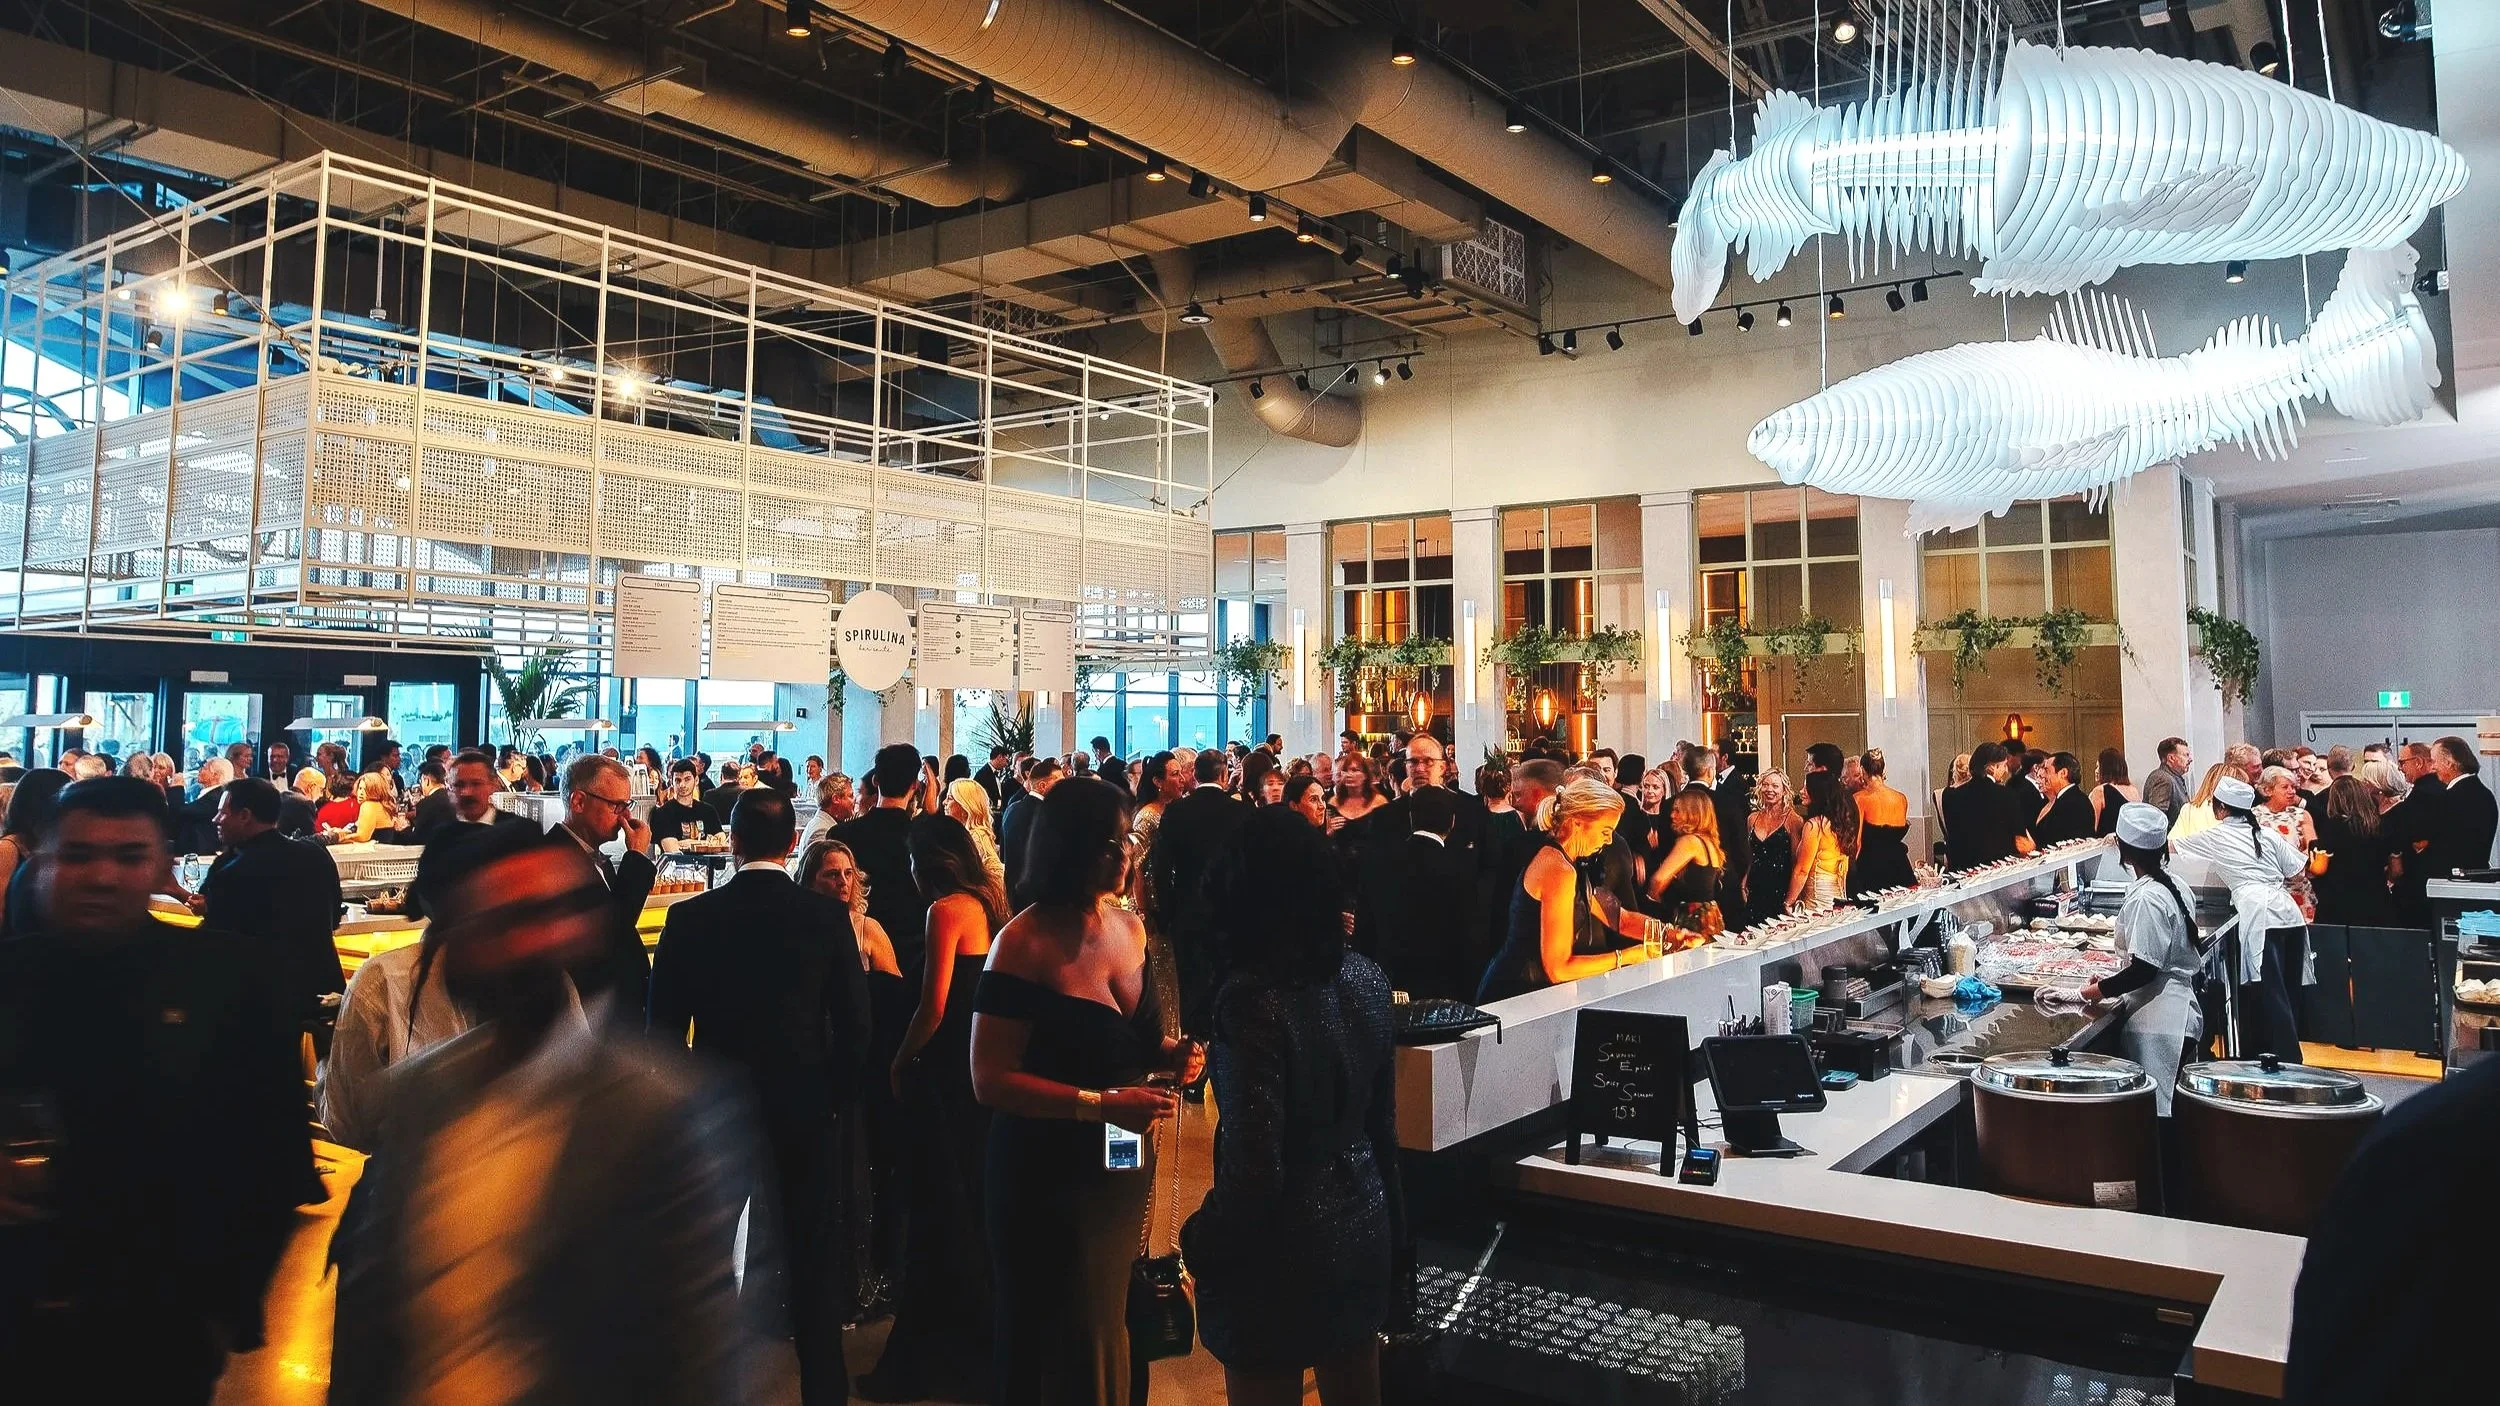
Le Fou Fou Food Hall, Montreal
Most of what's written about food hall economics is written from the outside — by analysts, consultants, and capital markets folks. There's good work in that body of writing. What it usually doesn't capture is the operator's view: what the P&L actually looks like at month-end, where the numbers actually come from, and where the margin actually leaks. This is that version.
Written for developers underwriting a hall, evaluating an operator, or trying to get under the hood of a financial model that doesn't behave like the rest of their portfolio. It covers the revenue lines, what a healthy hall actually earns, where the profit actually comes from, and the questions to ask before you sign an operator agreement.
The information is at the core of our consulting services, and this is the read we'd have wanted when we started.
1. The Numbers that Matter
Every hall is different — trade area, size, format, market — but for a healthy mid-sized urban food hall, the financial frame looks roughly like this:
Gross Revenue — vendor sales, beverage program, events and group dining, programming, sponsorship, retail. Every dollar passing through the building. Food hall gross revenue can range anywhere from $8M – $30M depending on size, location, format, and trade area strength.
Vendor Retention — the total share of vendor sales that the food hall operation keeps to fund the day-to-day operation of the food hall. Top-tier food hall operators run a full-service model with 25–30% vendor retention — covering rent, build-out, common area, marketing, utilities, technology, waste removal, and the operating support that justifies the share. Investors will also see base-rent-plus-CAM models in the market, which on the surface look simpler and cheaper to vendors. In practice, it's neither — vendors usually pay more over the life of the lease because they're now responsible for systems and services they're not equipped to run, and owners earn less because the operator's incentive to grow vendor revenue is muted. We believe a full-service model yields much better results across the board.
Cost of Goods Sold (COGS) — while cost of goods is a standard industry metric, this number on a food hall P&L looks very different from a standalone restaurant. That's because the cost of producing the food is the responsibility of individual vendors and includes the full operating costs of the vendors, cost of food, and vendor profit. From the food hall's P&L perspective, the vendor payout is effectively the pass-through COGS on vendor sales — even though the vendor's actual food cost is a fraction of that payout. If a food hall retains 30%, the vendor payout (pass-through COGS) is 70%. If the food hall operator is running the bars (which we strongly recommend), this cost of goods should fall in line with industry averages (18% – 25%). The exact bar COGS depends on the mix — liquor and beer run lower, wine higher, and a well-built NA program is among the highest-margin pours in the building.
Food Hall Operating Expenses (OPEX) — covers occupancy costs, labor, utilities, marketing, supplies, repairs and maintenance, insurance, banking and card fees, professional services, and the operator management fee. Rent and occupancy are intentionally included inside OPEX rather than carved out separately. This ensures the owner's rent obligation is satisfied in the operating waterfall before any management fees or profit distributions are paid — including ours. The owner gets paid first. Food halls are complex, labor-intensive businesses; total OPEX is a key metric, and it doesn't compress easily.
Total Owner Return — while there are different conventions for defining a food hall's net profit, the number we track for our development partners is Total Owner Return. This includes rent, NNN expenses, and net profit after all expenses. An honest pro forma assumes 8–12% of gross revenue as Total Owner Return and treats anything above that as upside earned through operating discipline. A pro forma built on a 15–20% Total Owner Return is aggressive and will likely require a walk-back at the end of the year.
2. Where the Revenue Actually Comes From
Most pro formas model food hall revenue as if it were a single line of commission income. Real halls have multiple revenue lines, and the mix between them is what separates a hall that compounds from a hall that plateaus.
For a healthy mid-sized hall, the mix falls into these typical ranges:

Food Hall Commissions from Vendor Sales — 60% to 70% of gross revenue — the biggest line. The vendor keeps most of the ticket; the hall takes a portion for operating expenses and overhead. Commission structures vary — flat percentage of vendor sales, tiered structures, or base rent plus a smaller revenue share. We prefer a model where the food hall operator handles the majority of the controllable operating expenses and takes advantage of the economies of scale across the operation, which justifies a greater share of total vendor revenue. The right structure is always adjusted to the trade area and the vendor type; there's no single right answer.
Beverage program — 22% to 30% of gross revenue — worth pausing on. The classic "bar program" is evolving. Younger generations are drinking measurably less alcohol than the generations before them — a real, well-documented shift that's reshaping every food and beverage category. The good news is that beverage revenue can be fully maintained with a thoughtful program: elevated non-alcoholic cocktails, NA beer and wine, functional and adaptogenic drinks, premium coffee, tea, and house sodas. A $14 mocktail creates the same return as a $14 cocktail. The operators getting this right are running a beverage program, not a bar program, and they're hitting the 22–30% range against the historical norm. Operators still pitching "the bar" as a single concept are quietly under-earning the line.
Private events and group dining — 6% to 12% of gross revenue — corporate dinners, holiday parties, brand activations, ticketed dinners, large group reservations, bus tours, box lunches, and off-premise pickup and delivery. We group these because they share the same operating muscle — booking infrastructure, defined vendor culinary capacity, and event-day execution. Sophisticated food hall operators strive to get as much advance group business on the books as possible – without interrupting the standard walk-in guest flow. This evens out the ebb and flow of the kiosk operations, increases vendor profitability, and creates a greater degree of predictability for the overall operation. Halls that build this muscle hit the upper end of the range; halls that leave it to "we'll figure it out" hit zero.
Delivery — variable by location, 0% to 10% of gross revenue — this revenue stream is extremely situational for a food hall. Some locations are ideally suited for off-site delivery through third-party partners like UberEats or DoorDash. Some food halls get so overwhelmed with walk-up business that it becomes impossible to support off-site delivery. Regardless of the situational viability, the fees collected by the food hall need to be adjusted for incremental off-site delivery to account for the delivery fees. If the total cost of delivery still leaves room for vendor profits, delivery becomes a viable revenue stream. Collecting full food hall fees on delivery orders will likely kill vendor adoption as the delivery orders go into negative profitability.
Programming — variable, captured indirectly — live music, trivia, sports viewing, retail pop-ups, partnership activations. Programming sometimes generates direct revenue (ticket sales, sponsorships, room rentals), but more often it shows up in the rest of the lines — a programmed Tuesday night drives beverage and vendor sales that wouldn't have happened otherwise. The right way to evaluate programming is by its lift on the other lines, not by its direct ticket revenue.
Sponsorship, partnerships, digital display advertising, and ancillary — modest but real — beverage exclusives, equipment sponsorships, brand activation fees, media partnerships, digital ad sales, and retail. Rarely the biggest line; often the cleanest margin — operators who do not capitalize on these opportunities are leaving big money on the table for the owners.
The mix varies by hall, and the bands above will not sum cleanly to 100% in any single case. But the mistake we see over and over: a developer or owner builds a hall assuming 90% of revenue will come from vendor commissions and is then surprised when the math doesn't work. Vendor commissions alone don't carry a food hall. The beverage program, the events and group dining muscle, and the programming calendar must be built into the operation from day one — not bolted on later when the hall underperforms.
(See Onset’s Food Hall Development Playbook 2026)
3. The Biggest Miss in Food Hall Operations
This is the section that wasn't going to come from an analyst.
The single most common reason food halls underperform isn't bad food, bad design, or a soft trade area. It's that the operating team only activates one or two of the available revenue lines — usually vendor commissions and maybe a basic bar — and leaves the other 25–40% of potential revenue completely on the table.
We've walked into halls with:
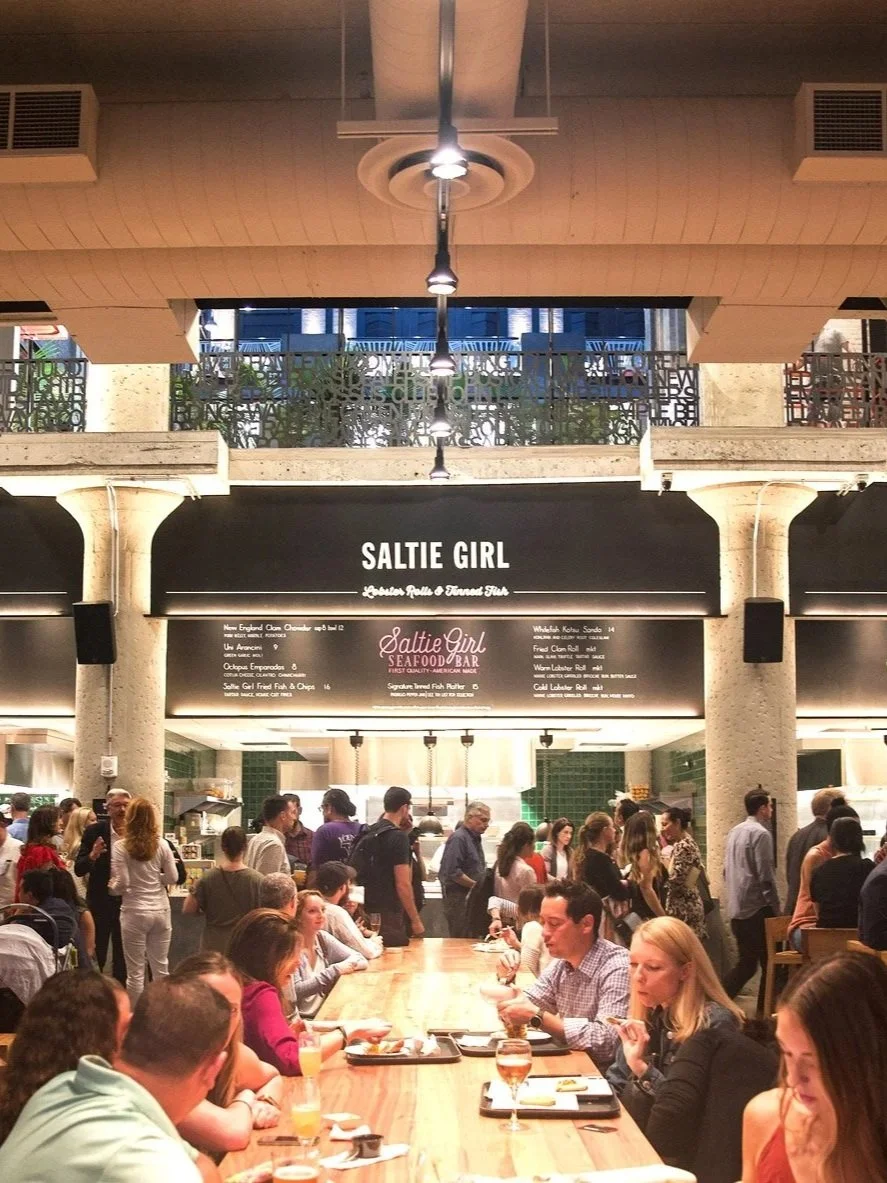
A booming lunch service and a beverage program that closes at 6 pm because "nobody comes in late."
A beautiful private events space that hosts two events a quarter because nobody is being paid to source the business.
A calendar with no programming, no partnerships, no activations — and a soft Tuesday-through-Thursday performance to show for it.
A central kitchen capable of catering and off-premise that's used at 15% capacity because the operating team has never built a sales process.
Vendor commissions are reported monthly with no comparable analysis of bar mix, beverage attach rate, group dining capture, or programming-driven lift.
Each of those is an unactivated revenue line. Individually, they look small. Combined, they're often the difference between an 8% EBITDA hall and a 12% EBITDA hall — which is to say, the difference between a hall that gets refinanced at par and a hall that gets refinanced at a premium.
The fix isn't more revenue lines; it's making sure every one of the lines the building can support is actually being run as a real program, with an owner on the team, a budget, a calendar, and a number to hit. (see Food Hall Operations.)
4. Questions to Ask Before Signing an Operator
When you're interviewing operators, the contract structure matters — but it matters less than whether the operator can actually run the place. Eight questions that surface the difference quickly:
1. How does the food hall make money?
Look for answers beyond basic food sales and bar revenue. Look for incremental revenue streams, advertising revenue, group dining, sponsorship revenue, ticketed events, etc., and ask specific questions on HOW these revenue streams are activated. If an operator doesn't have concrete answers, the operation is going to struggle.
2. What's your specific advertising and marketing plan for year one and year two?
You want to hear about ongoing marketing — not just a pre-opening PR push. Halls that go silent after opening pay for it twice: once in soft revenue, once in the cost of relaunching attention later. The right answer includes a named owner, a monthly budget, and a year-two calendar.
3. What's your catering, off-premise, and group dining strategy?
This is where the 6–12% revenue line lives. If the answer is "we'll see how it develops," that revenue isn't going to develop. The right answer has a sales process, a target mix, and infrastructure choices (catering kitchen, booking platform, sales lead) baked in.
4. How does your beverage program adapt to declining liquor consumption?
This question separates operators who are watching the category from operators who are running 2018's playbook. The right answer addresses NA cocktails, functional beverages, premium coffee and tea, and the price architecture that keeps revenue per pour stable even as the mix shifts.
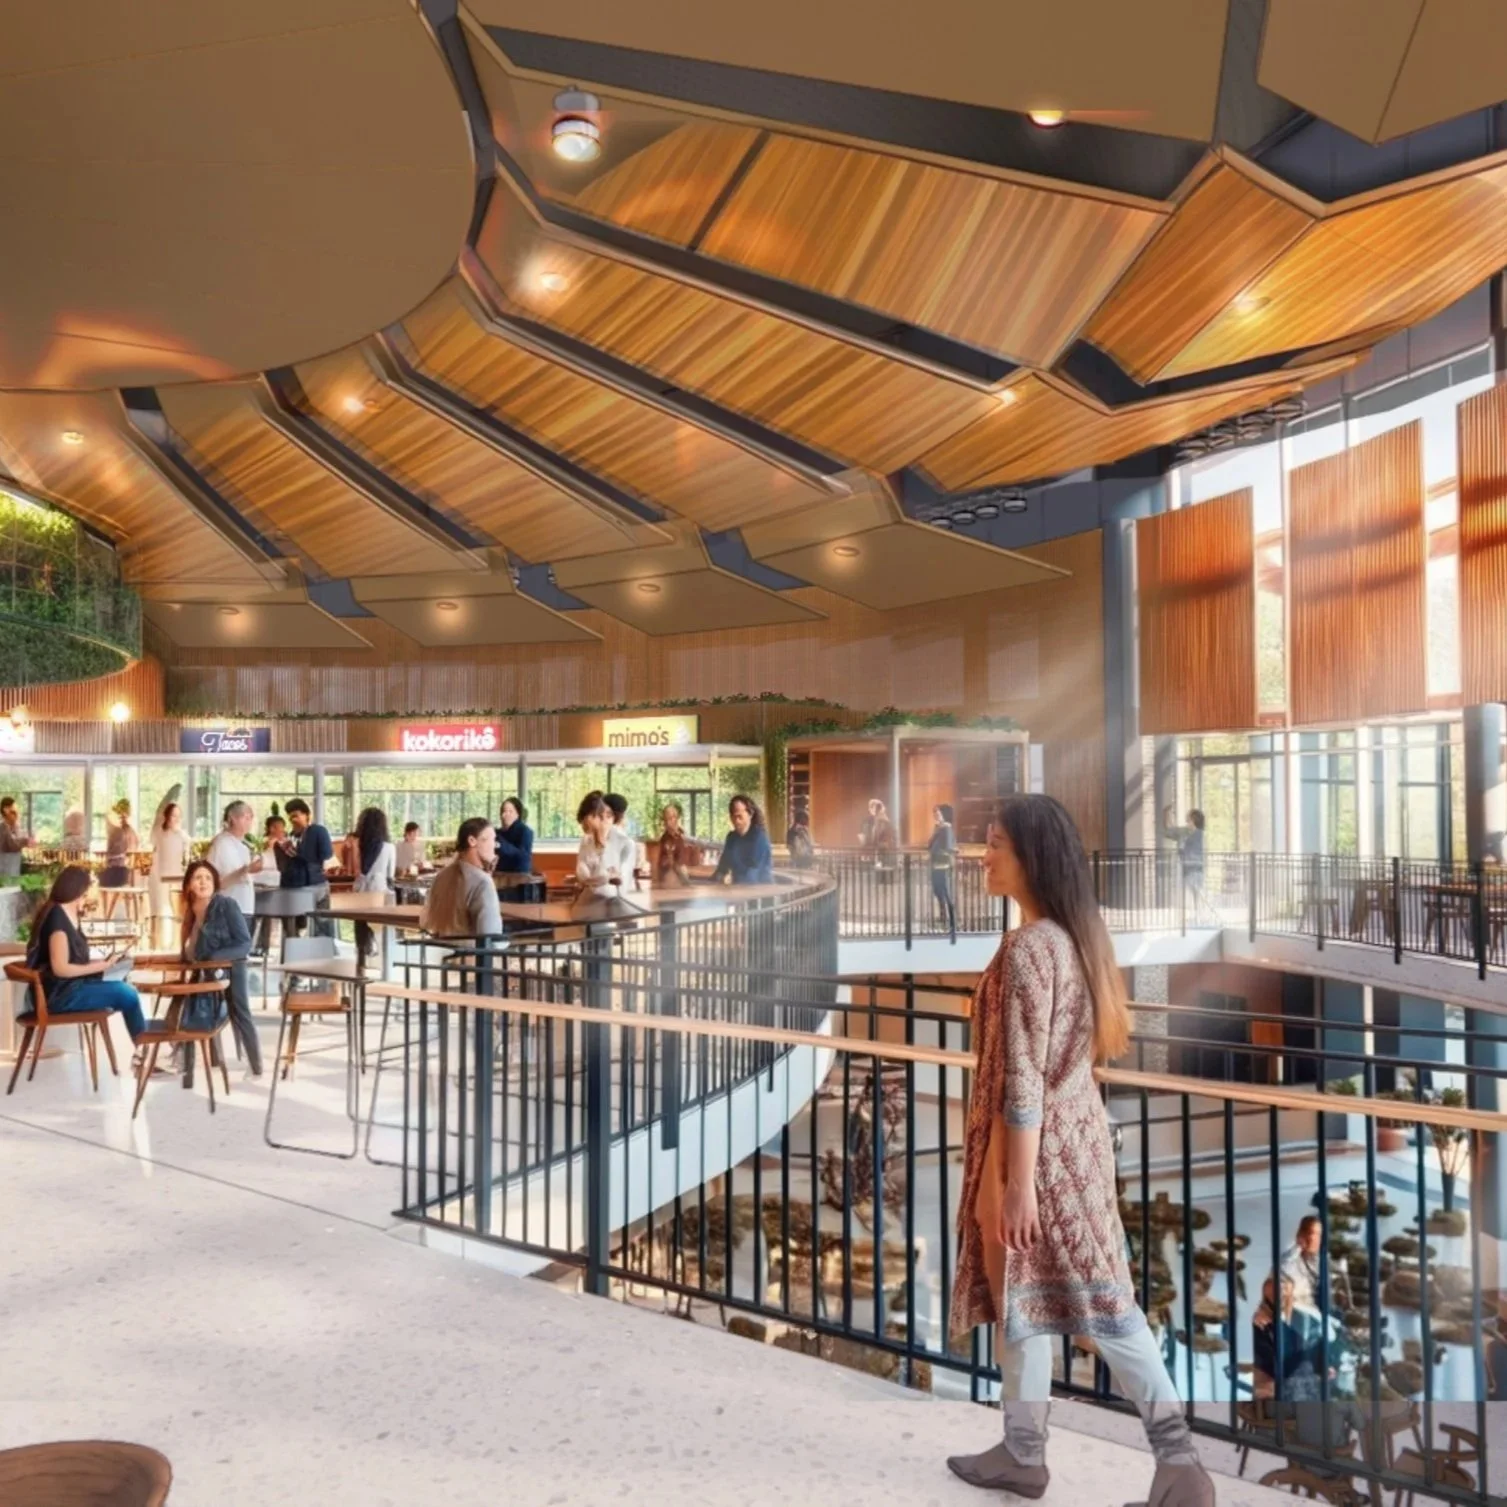
La Villita Food Hall
5. How do you handle vendor turnover?
You want to hear about an active recruiting pipeline running continuously, not reactively. The right answer includes specific performance triggers in the lease, a structured improvement process, and a curated bench of two to three replacements being maintained at all times — even when every stall is full.
6. What's your year-two plan, separate from your year-one survival plan?
Year one is the hardest year — exploratory, capital-intensive, full of surprises. Year two is the year the hall stabilizes after a full annual cycle. An operator who can't articulate both the year-one capital and contingency plan AND the year-two refinement plan hasn't actually built one.
7. What's your operating expense target as a percentage of gross revenue, and how do you hold it?
A real operator can answer this within a 2–3 point range without flinching, and labor should be inside the number — not adjacent to it. Look for a labor management process specifically; labor is the largest opex line and the one that quietly creeps in non-peak windows.
8. What's your fee structure, and what aligns your incentives with ours?
Most management agreements combine a base management fee with a performance incentive tied to NOI above a threshold. The structure matters less than whether the performance incentive is meaningful enough to actually drive the operator's behavior. If the base fee is large and the incentive is small, the operator is paid to show up, not to perform.
The answers to these eight questions will tell you more about whether an operator can run your hall than any pitch deck.
(See Onset’s Food Hall Consulting Services)
5. Year One is the Hardest Year
The conventional narrative — that launch buzz carries year one and year two is where it gets hard — has the cycle backwards. In our experience operating halls, year one is the hardest year. It's the exploratory year, the survival year, the year you're paying tuition on lessons the feasibility study couldn't teach you.
Operators often get a two-to-three-month bump from opening and then experience a drop in revenue as the operation learns what the trade area actually shows up for, not what the demo data predicted. You watch vendors find their stride or fail. You see all four seasons and learn how each one hits your specific location. You discover daypart rhythms that don't match the pro forma. You manage the launch surprises that every hall has — operational, mechanical, market-driven — and you absorb the cost of fixing things that weren't built right the first time.
Capital reserves matter more in year one than in any other period. Operators with adequate runway can ride year-one surprises calmly and make patient adjustments. Operators on thin reserves make panic decisions — cutting marketing too early, slashing labor without measuring impact, rushing vendor replacements without proper vetting — and lock in damage that takes years to undo.
Year two is the foundational year. The operation stabilizes after a full annual cycle. You've been through every season, every holiday, every slow week and every busy one. The vendor mix you've ended up with isn't always the one you started with, but it's the one that actually works. Now you can refine with conviction — sharpening the beverage program, evolving the events calendar, tightening labor against real demand, scaling the programming that drove footfall last year.
Year three is when compounding starts to show up. A stabilized hall that's been deliberately refined begins to grow NOI year over year. That's the curve that takes a hall from a refinance candidate to a sale-at-premium candidate.
Three patterns we see across the cycle:
The compounding hall. Adequately capitalized through year one. A patient operator who explored, learned, and didn't make panic decisions. Stabilized through deliberate refinement in year two. Year three forward shows NOI growth across every revenue line.
The surviving hall. Survived year one but didn't actively refine in year two. The operating team treated stabilization as a destination instead of a foundation. Performance settles at modest profitability and stays there.
The decaying hall. Undercapitalized for year-one exploration. Made panic decisions during the hardest months. Didn't recover. By month eighteen, the operating model has compounded the early mistakes instead of correcting them.
The difference between the three is rarely the trade area or the building. It's the combination of adequate year-one capital reserves and a year-two operating discipline that actually refines rather than coasts.
That combination is what turns 8% EBITDA into 12% and beyond. And it's what you're underwriting when you sign an operator agreement — the capital plan for year one and the refinement discipline for year two.
6. What this means for you
If you're underwriting a hall, anchor your pro forma on 8–12% Total Owner Return on gross revenue, plan for 28–32% operating expenses inclusive of labor, build adequate capital reserves to fund year-one exploration without forcing panic decisions, and assume vendor commissions alone will not carry the project. Build the beverage program, the events and group dining muscle, and the programming calendar into the operating plan from day one.
If you're choosing an operator, run them through the eight questions above. The answers separate operators who run programs from operators who run a pitch deck.
If you're early on a project and want a clear-eyed read on whether your site supports a food hall — and what economic shape it should take — that's the conversation we're built for.
FAQ
-
Food hall gross revenue typically ranges from $8M on the low end to $30M+ for destination-scale halls, depending on size, location, format, and trade area strength. Neighborhood halls cluster at the lower end; urban flagships and destination markets reach the upper end. The right way to size revenue is from the trade area up — viable vendor count × $12K–$15K per vendor per week as a floor — not from a target revenue number down.
-
8% to 12% of gross hall revenue is the working range for a healthy hall, with operating expenses running 28% to 32% of gross revenue inclusive of labor. Halls running above 12% have usually activated every available revenue line — beverage, events, group dining, programming — and are managing labor against a real dashboard. Halls running below 8% have typically left two or more revenue lines unactivated or are carrying excess labor cost.
-
Vendor commissions are the largest line (60–70% of gross revenue), followed by the beverage program (22–30%), private events and group dining (6–12%), delivery (0–10% where viable), and programming and sponsorship as smaller but meaningful lines. Halls that lean only on vendor commissions consistently underperform.
-
At present, 22% to 30% for a well-run program. The category is shifting as younger generations consume less alcohol, but beverage revenue can be fully maintained with a modern program that includes non-alcoholic cocktails, NA beer and wine, functional beverages, and premium coffee and tea. Operators still running a traditional bar without these categories are under-earning the line.
-
Eight questions matter: how the food hall actually makes money beyond basic food sales and bar revenue; the specific advertising and marketing plan for year one and year two; the catering, off-premise, and group dining strategy; how the beverage program adapts to declining liquor consumption; the vendor turnover process; the year-two plan separate from the year-one survival plan; the operating expense target as a percentage of gross revenue and how it's held; and the fee structure and how it aligns the operator's incentives with the owner's.
-
Year one is the hardest year — exploratory, capital-intensive, and full of surprises the feasibility study couldn't anticipate. The hall learns its trade area, its daypart rhythms, and its actual vendor mix through a full annual cycle. Capital reserves matter most in year one because they let the operator make patient adjustments instead of panic decisions. Year two is the foundational year, when the operation stabilizes after that full cycle and deliberate refinement becomes possible. Year three is when compounding starts to show up.